- Video Tutorial – Navigating the Orbital Stack Viewer
- 1. Choose a Project
- 2. Choose the Scenario / Configuration to View
- 3. Browse the Results
- 4. Split Screen
- 5. Properties
- 6. Display a Color Legend
- 7. Display Wind Information
- 8. Save a Camera Angle
- 9. 2-D View and 3-D View
- 10. Clipping Plane
- 11. Screen Shot
- 12. Navigate the Viewer
- 13. Compass
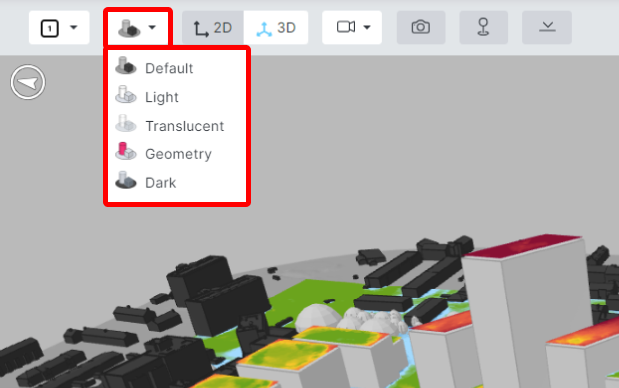
- 14. Change the Theme
Video Tutorial – Navigating the Orbital Stack Viewer
1. Choose A Project
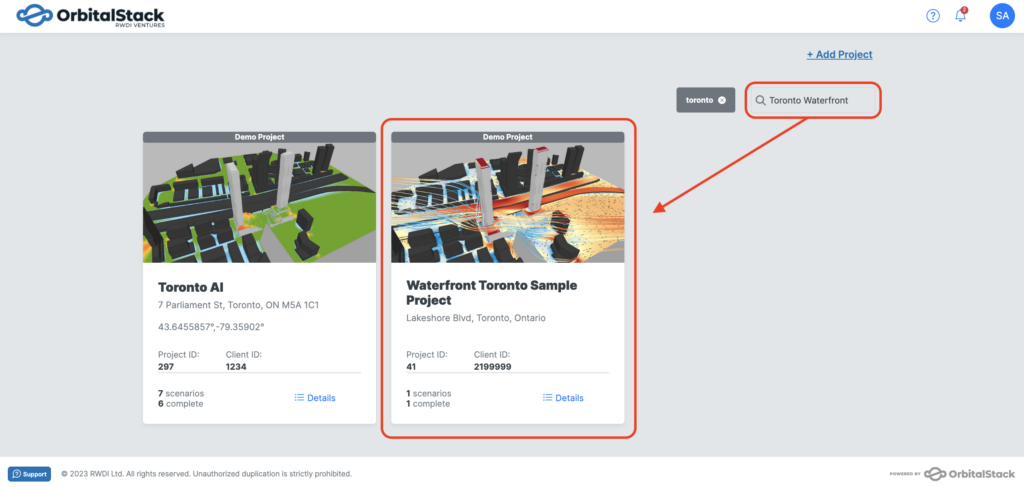
Find your project, either by scrolling or using the search bar. Select the project to view:
2. Choose the Scenario / Configuration to View
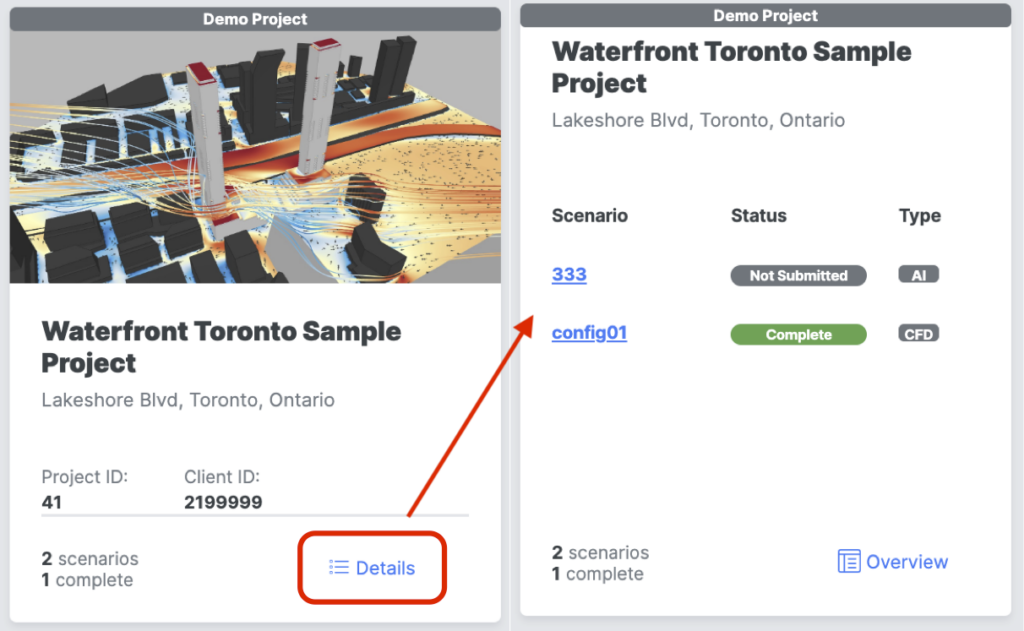
There are multiple ways to view the different scenarios (building configuration) within your project. You can select the scenario directly on the project tile of your home page by clicking the details option. This will pull up your previously created scenarios.
If you’re already in the viewing window of your project, you can view your scenarios at the top left-hand side of the screen from the drop-down under the project name:
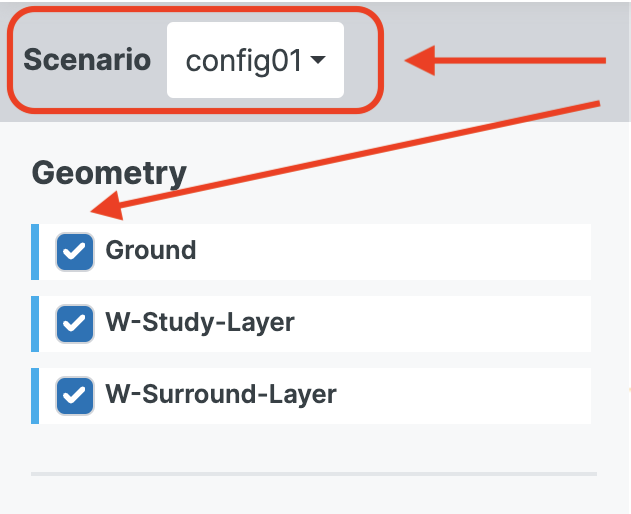
HINT: If you do not see your model or other parts of your Geometry, make sure you have the Geometry options selected.
An alternative option to view the scenarios is within your “Project Settings”, under the “Scenarios” tab.
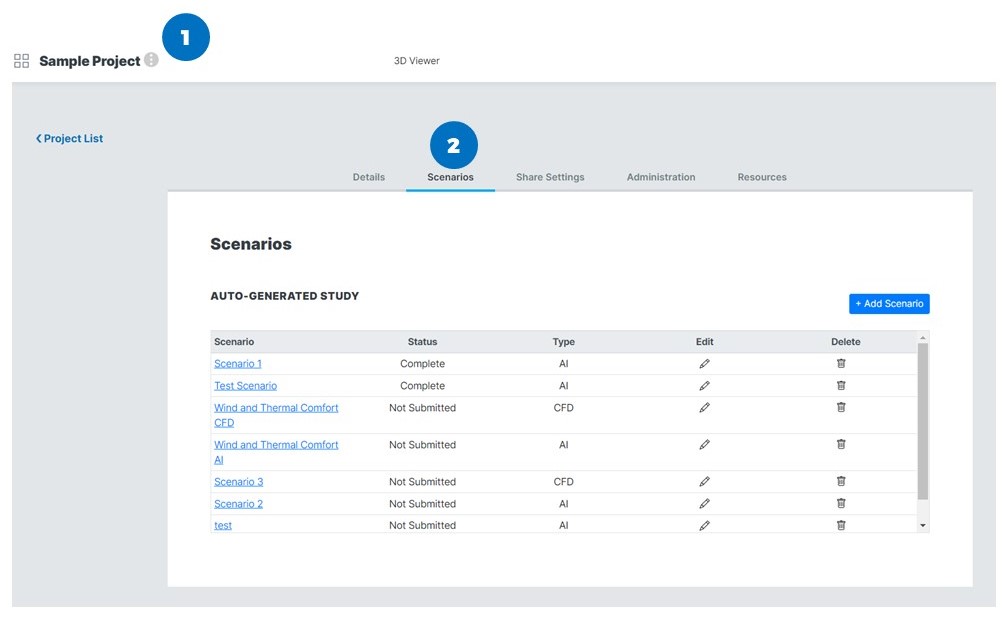
Note: In this tab, you can check the simulation status, simulation type, update the scenario name, and create a new scenario.
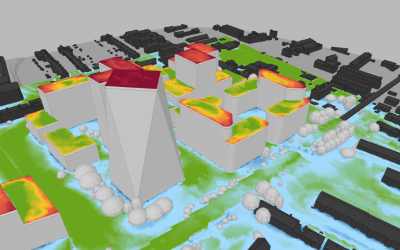
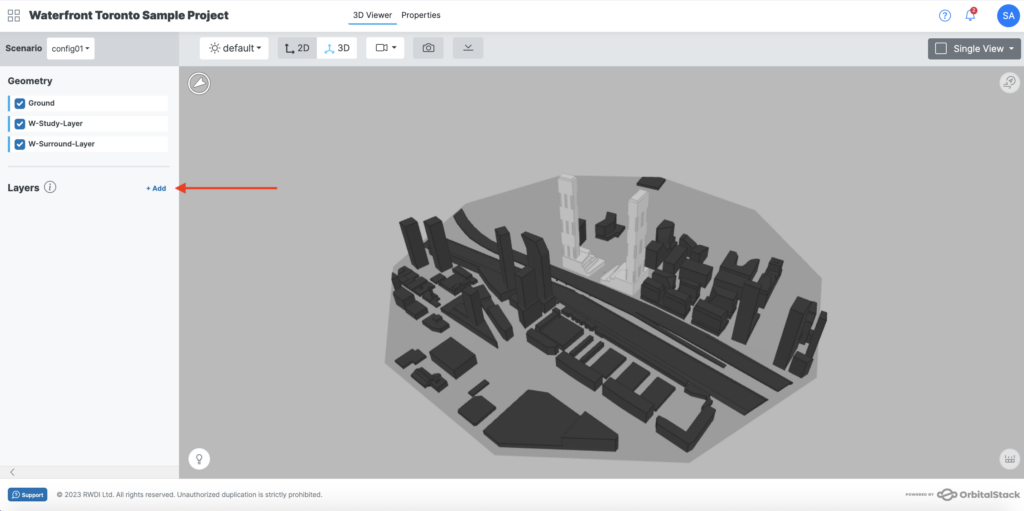
3. Browse the Results
The interface will now display your geometry. To review your simulation results, select the +Add in the Layers section.
Layers are divided into Horizontal and Volumetric*. (Horizontal are for typical surface plots, Volumetric are for streamlines). NOTE: Volumetric layers are only available when running a CFD Simulation. For a detailed explanation check out Choosing Your Simulation Approach – AI vs CFD
Once you click the +Add button, the Layer Picker will open. This view allows you to select multiple layers (or simulation results) and add them to the Viewer:
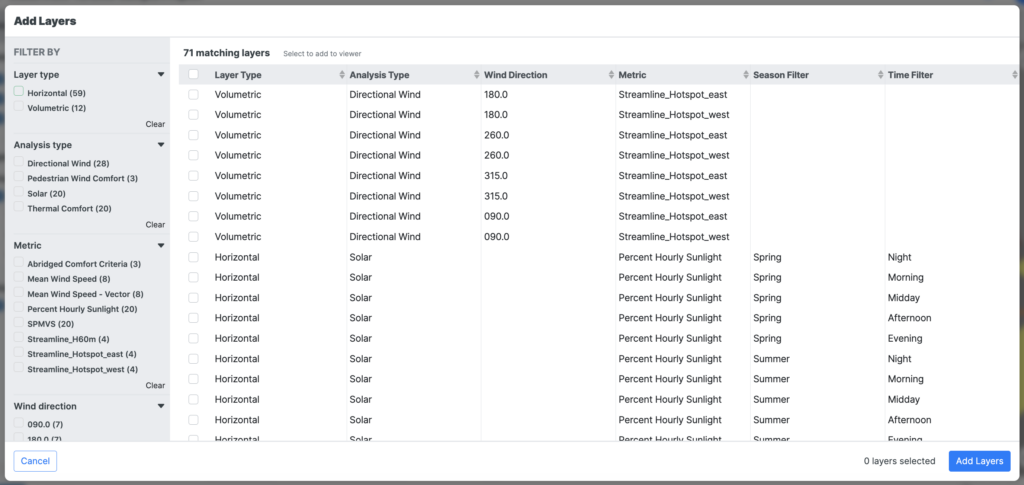
You can filter the view of your layers by:
Layer Type – Layer Types can be either Horizontal, Vertical, Volumetric. Horizontal pertains to predominately surface results that will indicate levels of wind, sun, shade etc. Vertical are slices through space showing how the wind is moving through a particular space. Volumetric pertains to streamlines in a 3-dimensional space so you can see how wind is traveling and at what velocity. Once all your desired layers are selected, click “Add Layers” in the bottom right hand side of the screen. Note: You may auto select all the layers by clicking the box beside “Layer Type”.
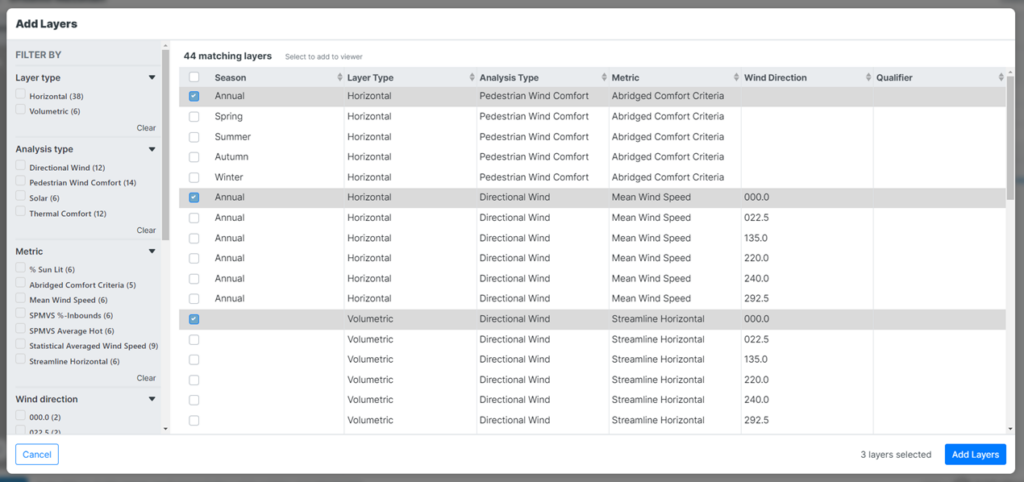
Analysis Type – The available Analysis Types will depend on your selection prior to running a new simulation. They can include; Pedestrian Wind Comfort, Thermal Comfort, Directional Wind, Solar and Thermal Comfort. Check out our Analysis Types & Associated Metrics Page for more detailed information.
Metric – This section refers to the specific metrics used in each Analysis Type. Check out our Analysis Types & Associated Metrics Page for more detailed information.
Wind Direction – The section refers to which direction the wind is coming from. See diagram for wind direction and its associated degrees.

Season – This section refers to your ability to select what season your simulation results will capture. Your options are: Annual, Autumn, Spring, Summer, or Winter.
Time -The section refers to your ability to select what time of day your simulation will capture. Your options are: Daily, Afternoon, Evening, Midday, Morning and Night.
Once you have selected your desired layers, you can click the Add Layers button, which will take you back to the main Viewer screen:
From the Viewer, you can then select each layer by checking the white box to the left of the Layer title. Once this is checked, your results for this layer will appear within your model:
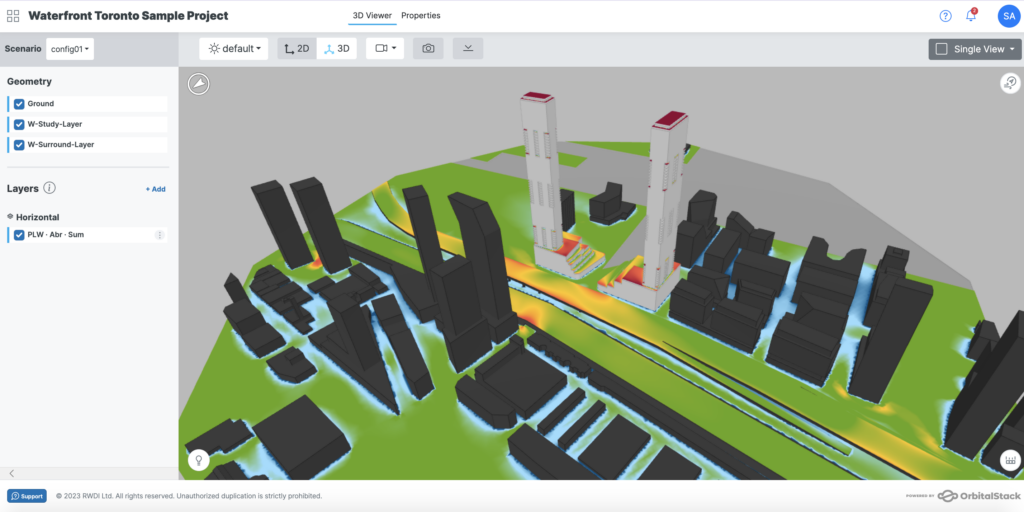
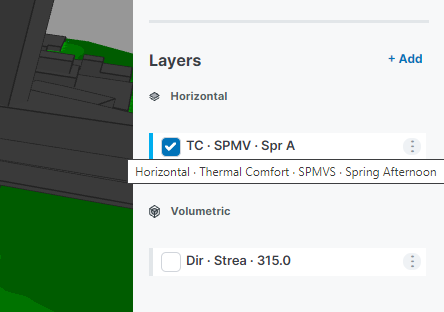
HINT: You can hover your mouse over the Layer title to get an expanded view of the title.
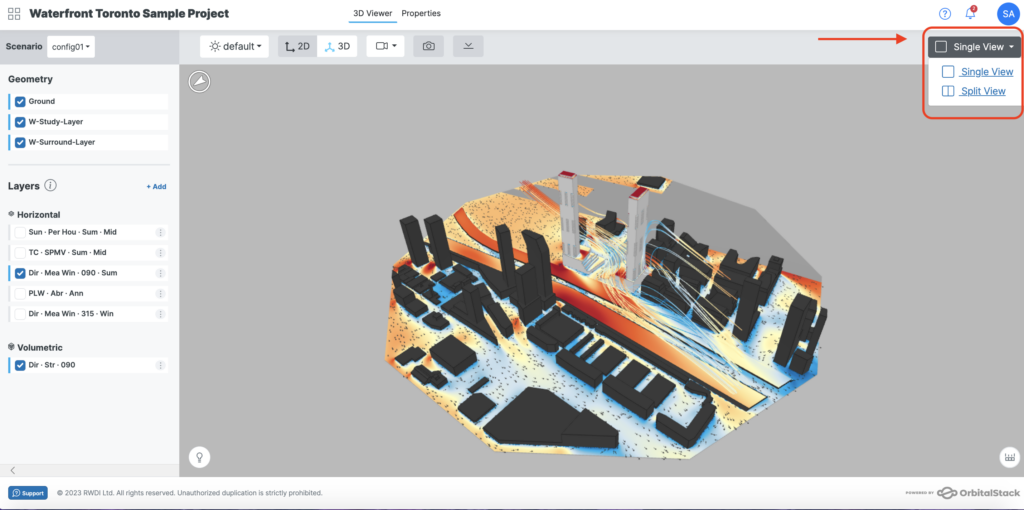
4. Split Screen
Split your viewer into two screens by selecting the “Single View” drop down then choosing “Split Screen”. This can be used to view two different layers or scenarios side by side.
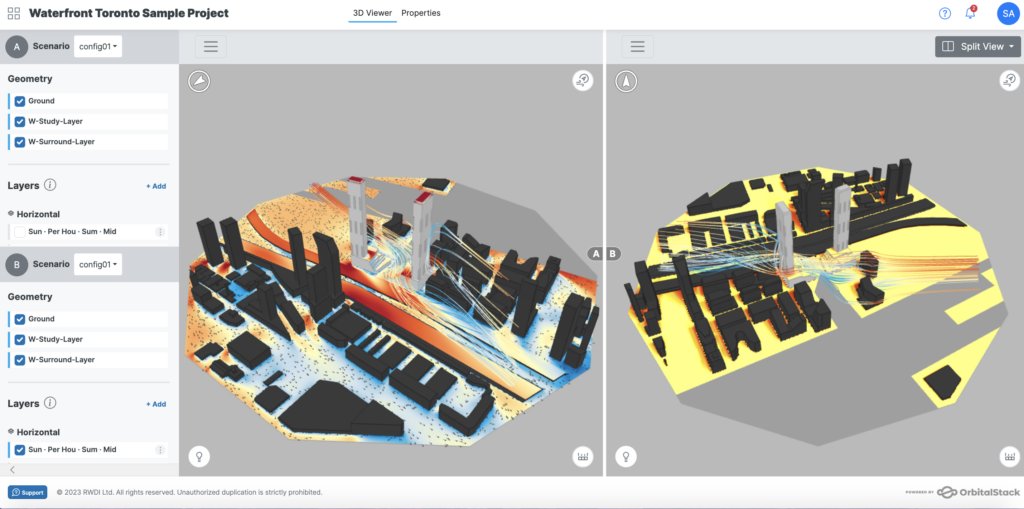
Note: For quick and easy access, save the URL to navigate quickly to the split screen view.
You can select layer types separately for screen A and screen B. This can be useful to compare two differently designed scenarios side-by-side or wind directions and seasons.
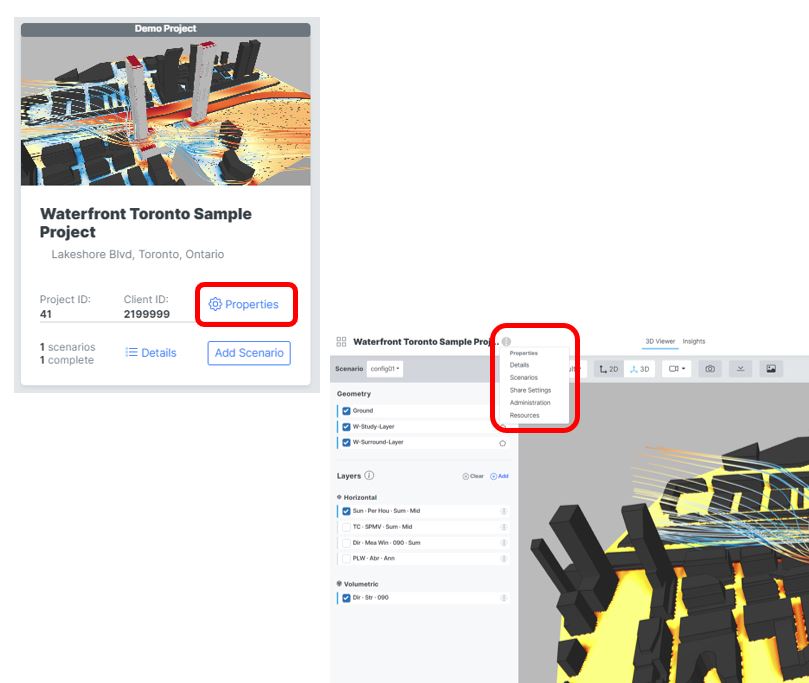
5. Project Properties
Selecting Properties will allow you to view the Project Details, Scenarios, Share Settings, Administration, and Resources options. To access your Project Properties click on the “Properties” button directly on the project tile OR in the 3D Viewer:
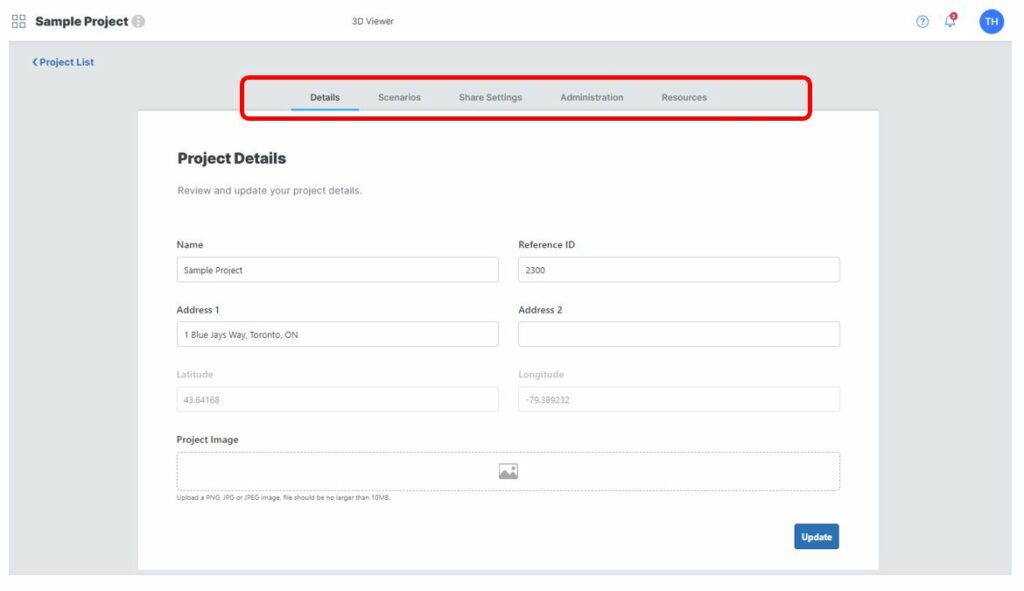
5.1 Details
When first creating a project, you will need to specify certain details such as the project name, address, geolocation, etc. If you would like to make any changes to this information, you may do so from within the Project Details page. The geolocation is the exception and cannot be adjusted.
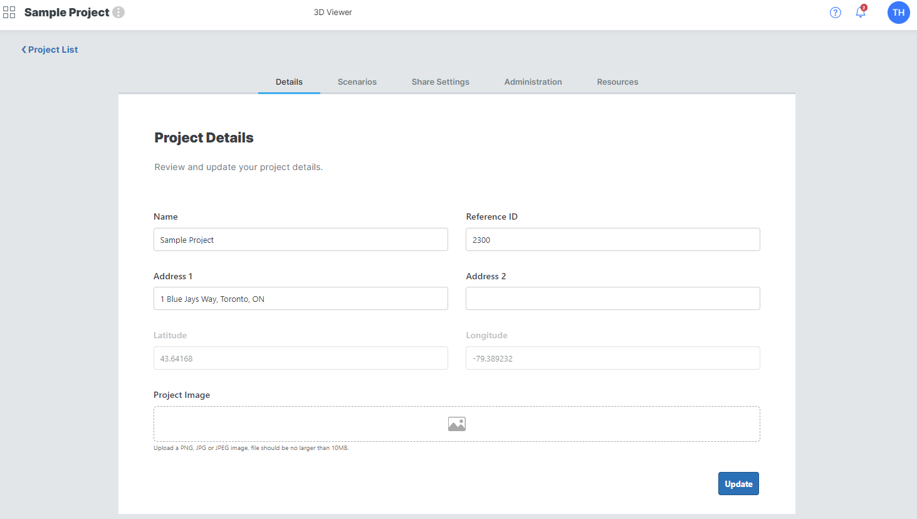
You can upload an image of your project here to appear on your project tile.
When you are satisfied with your changes, click “Update“.
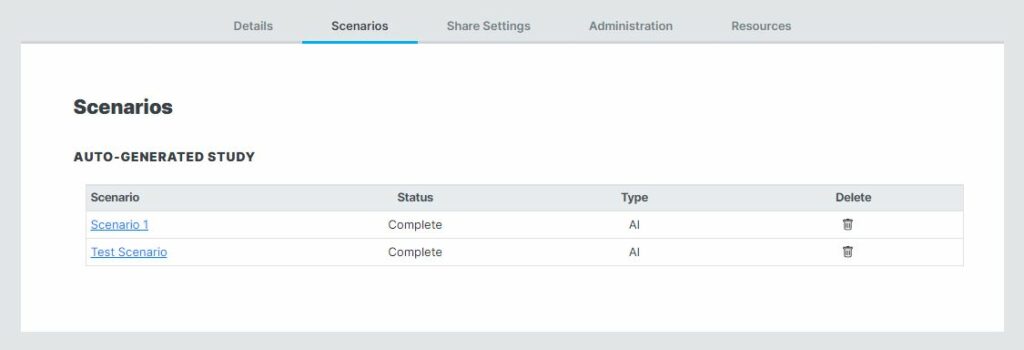
5.2 Scenarios
Scenarios tab shows all scenarios created under the current project, the status of each scenario and type of simulation run i.e. AI, CFD.
If you no longer require a specific scenario, you have the ability to delete a scenario here.
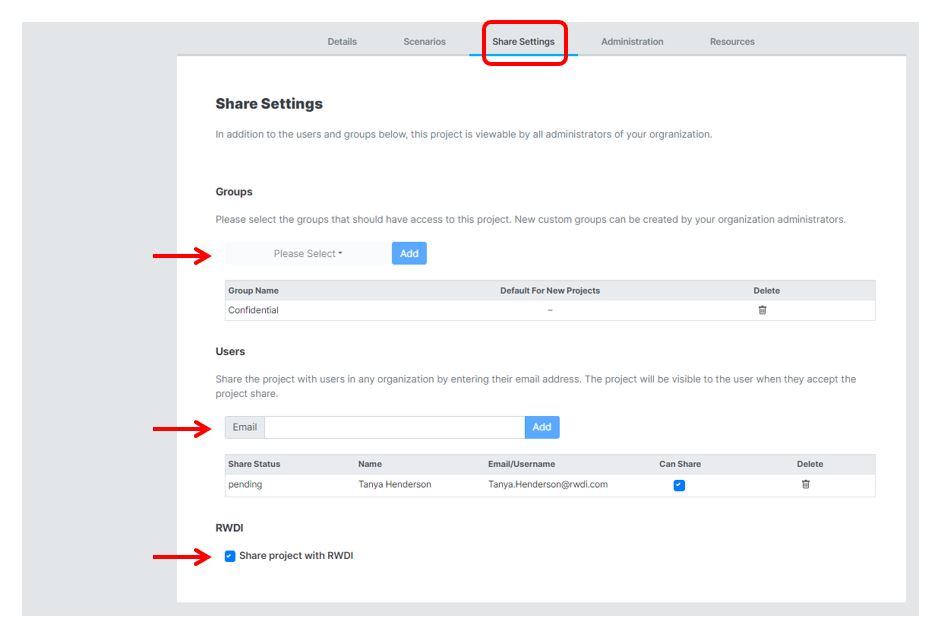
5.3 Share Settings
Share settings enable you to specify who can access your project. Projects may be shared with Share Groups or specific individuals. You may also share projects with all RWDI Engineers.
Note: Share Groups are managed by your Company Administrator and only contain users from within your company / organization.
– Share Groups
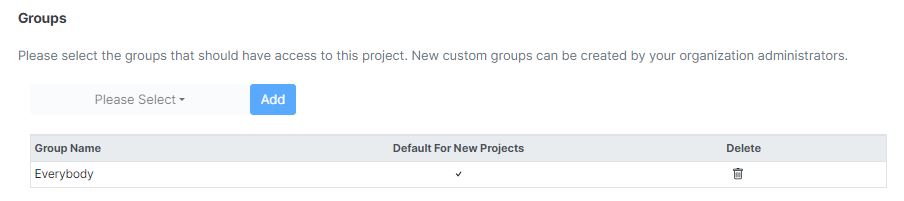
To share your project with a Share Group, find the desired share group in the drop-down menu and click “Add”. The project will now be shared with all users in that share group.
To stop sharing the project with a share group, simply click the Trash icon to the right of the desired share group.
For instructions on how to create Share Groups go to our Company Administration page.
– Share with Individual Users
To share your project with a specific user, type their email address into the search bar under “Users”, then click “Add”. The user will then be sent an invitation to access the project.
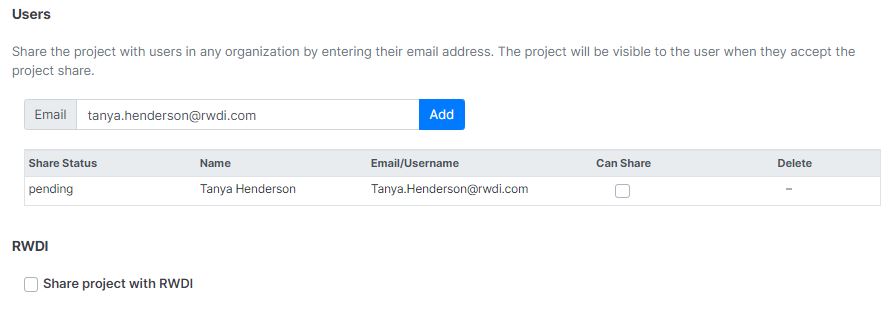
Note: The user must accept the invitation in order to access the project, this will show up in the notification bell at the top right of your screen. If the user does not have an Orbital Stack-affiliated account, they will be prompted to create one.
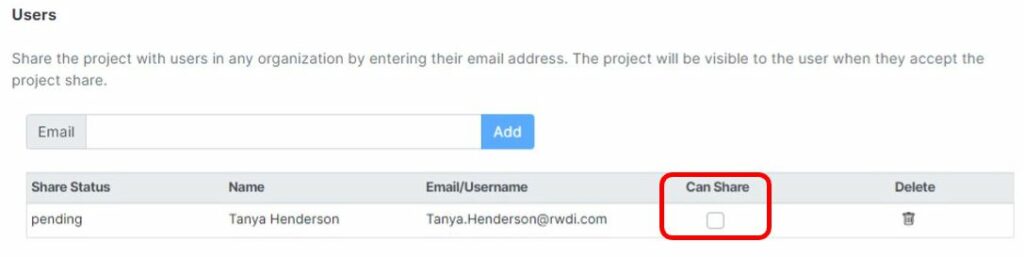
After you have shared the project with the given user, you can grant them permission to allow this user to share the project with other users by checking the Can Share box.
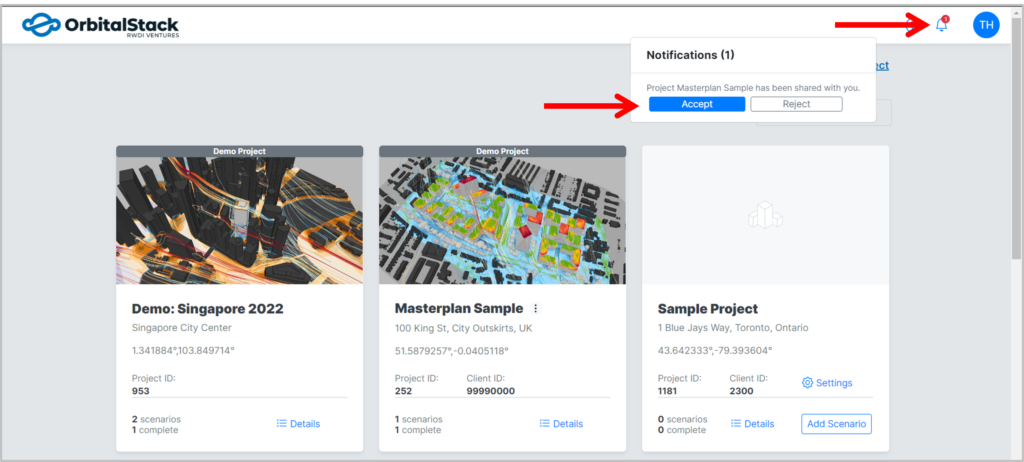
– How to Accept a Project Share
Log in with your credentials from https://app.orbitalstack.com/login/. If you do not have an Orbital Stack account, sign up at https://app.orbitalstack.com/signup
From the projects page, select the notification bell in the top right of your window. You will see a list of projects that were shared with you by others. Select “Accept” to gain access to the shared project.
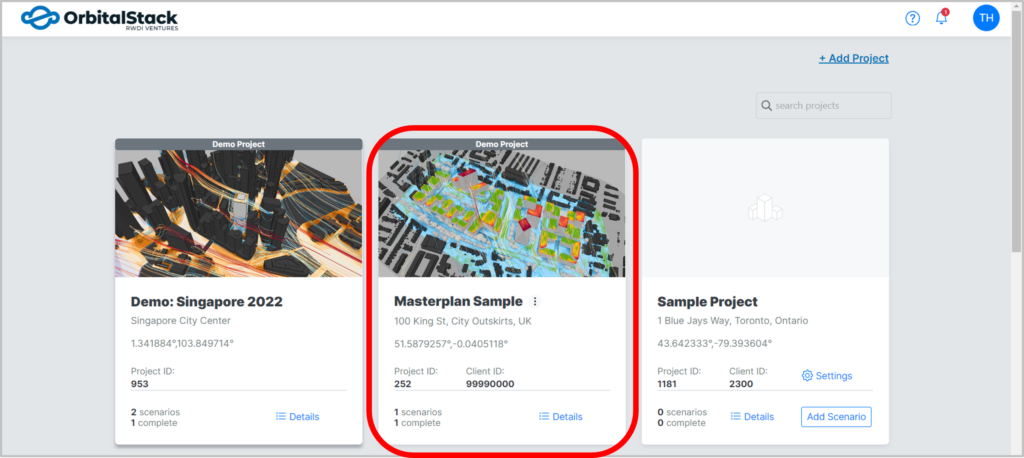
After accepting a project share, it will now appear as a project tile on your projects page.
5.4 Administration
To give other users the same privileges as the project owner, you may assign additional project administrators to the project. This will enable them to edit, share, and add new project admins to your project. You can only give this privilege to users within your own company.
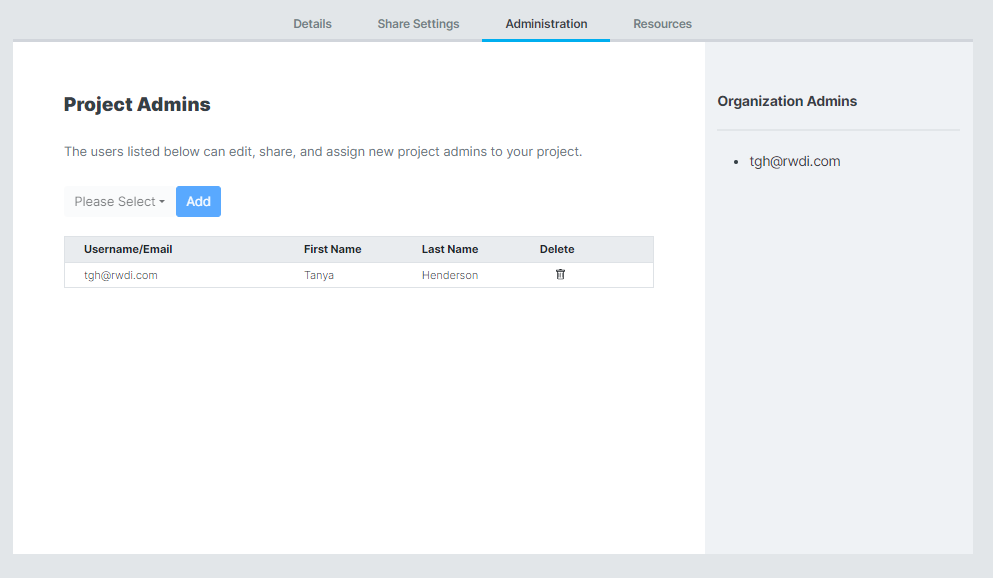
Note: Organization Administrators have full access and permissions and can be viewed in the right hand column of the screen above. They can also be assigned under your Company Administration page. For more information please visit Company Administration Page Explained.
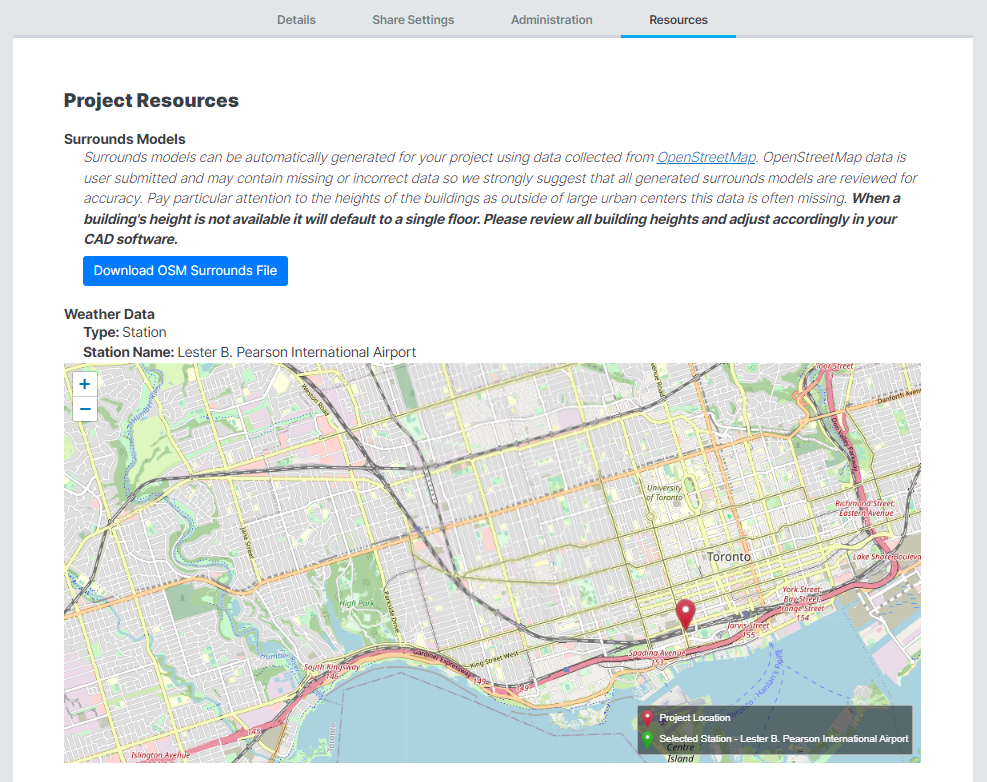
5.5 Resources
The Resources tab is where you can download or request your surrounding context model for your project location.
The Weather Data source is identified and a map is provided with a pin to identify your project location and weather station selected (if you selected measured weather data).
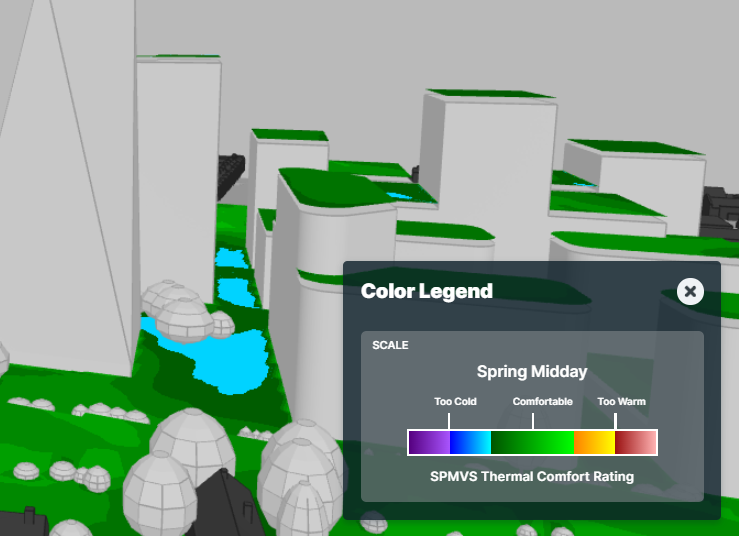
6. Display a Color Legend
A legend can be shown by clicking on the small icon (see icon below) in the lower righthand corner of the Viewer. The Color Legend will change depending on the Analysis Type that is being displayed. Use the Color Legends Explained guide to understand what is being measured and how to fully interpret your results.
Click this icon to view the color legend:

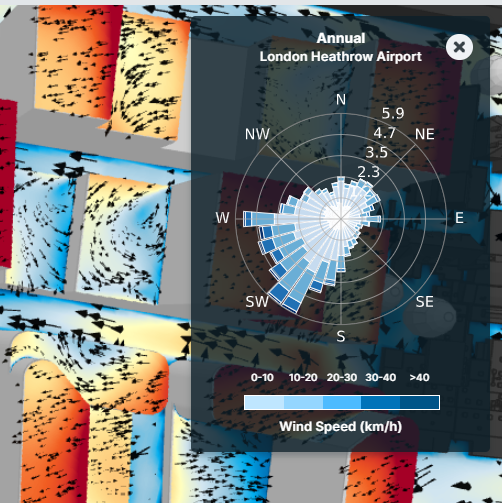
7. Display Wind Information
When detailed wind rose data is available (currently only for wind simulations and select projects), it can be shown by clicking on the icon in the upper righthand corner of the Viewer.
Depending on available data, the wind rose will match, as closely as possible, the season and time range of the layer being displayed. If no matches are found, annual data is displayed.
Click this icon to view the rose data:

8. Save a Camera Angle
It is often desirable to return the view to exactly the same orientation as a previous visit in order to generate screen captures with identical placement of reference geometry. Saving and reusing ‘Camera Settings’ provides this ability.
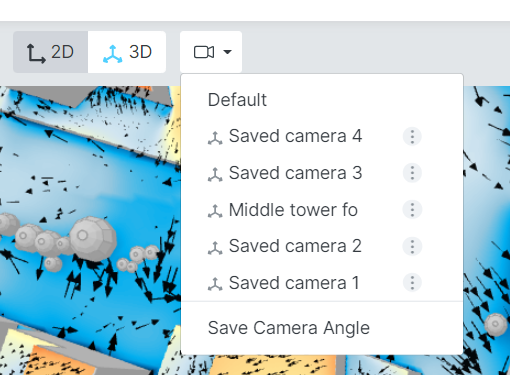
Orient your screen to the angle you would like to save then click the Camera icon and choose “Save Camera Angle”
You can then name the angle and save it. Saved angles will be displayed in the Camera Icon drop down.
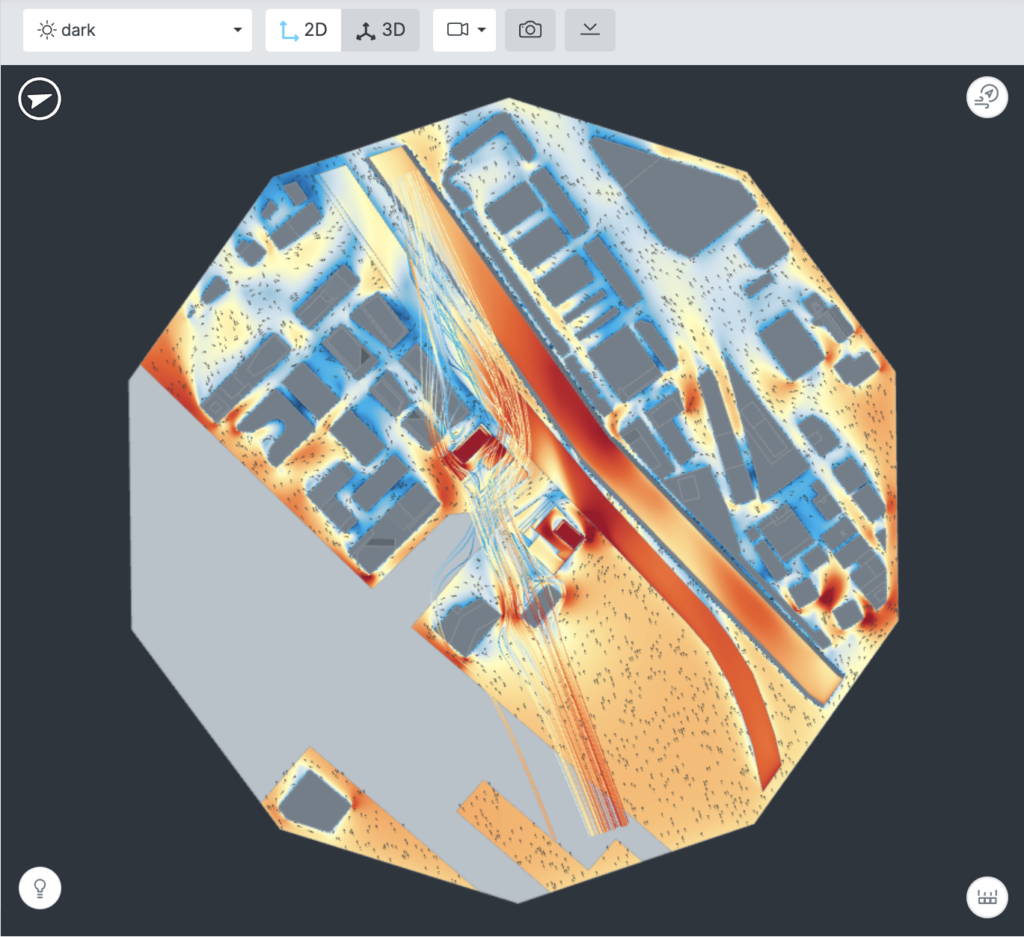
9. 2-D View and 3-D View
You can select either a 2-dimensional or 3-dimensional view of the Geometry by clicking the buttons at the top of the Scenario toolbar. You can toggle between both and save different camera angles as desired:
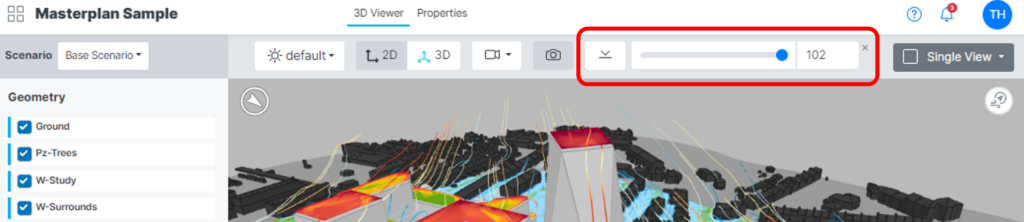
10. Clipping Plane
The clipping plane allows you to section through a building, which helps reveal buried results hidden below an overhang i.e. cantilevered geometry. You can either toggle the pane or manually adjust the height in meters.
11. Screen Shot
To save an image of your current view, click on the camera icon and then select your aspect ratio and the resolution size of image. Click “current display” to download the current view. To download this view with all results layers, click the download “all layers” button.
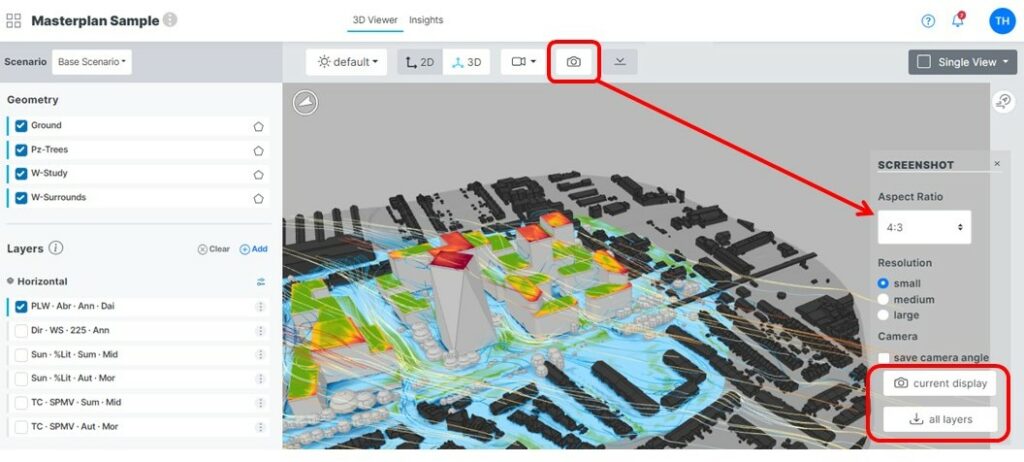
You also have the ability to save your camera angle here.
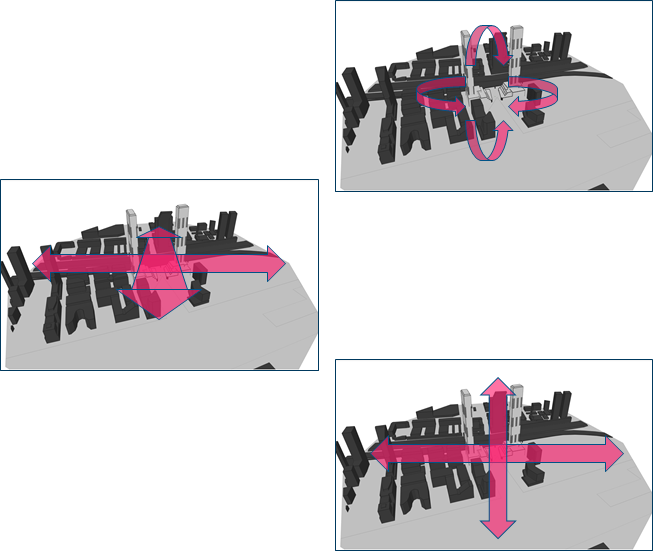
12. Navigate the Viewer
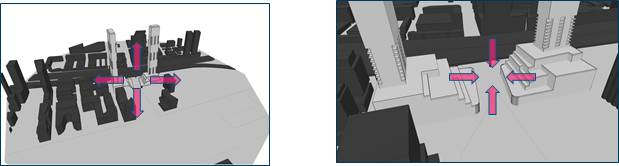
Hold the left mouse button to rotate and spin the model around the focal point.
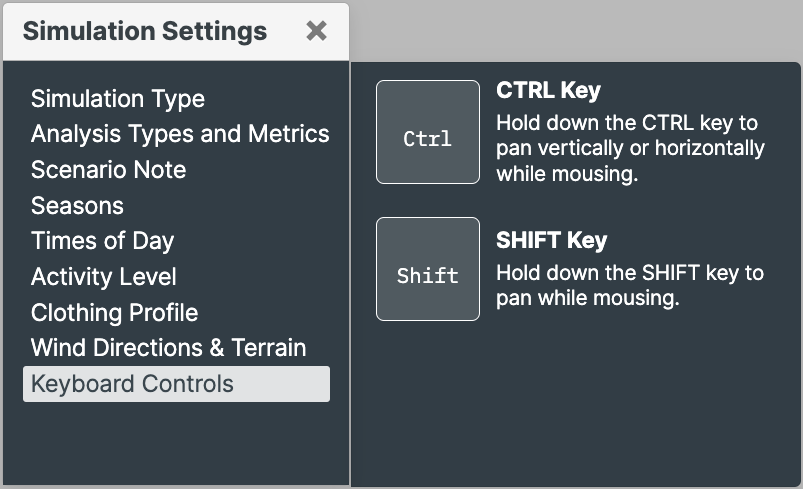
Hold the <SHIFT> key and the left mouse button to pan the model left/right or forward/backward relative to the focal point.
Hold the <CTRL> key and the left mouse button to pan the model up/down or left/right relative to the focal point.
Scroll the mouse wheel to zoom. Scroll up to zoom in and scroll down to zoom out.
The Simulation Settings can be found by clicking the lightbulb icon in the lower left-hand corner of the Viewer.

You may use these controls to assist in viewing your simulation:
Simulation Type: Identifies the type of simulation of the current scenario.
Analysis Types and Metrics: Identifies the analysis types being simulated and which metrics were used.
Scenario Notes: The notes you entered when submitting the simulation will be visible here.
Seasons: Identifies the seasons selected.
Time of Day: Identifies the times of day selected.*
Activity Level: Identifies the activity level selected.*
Clothing Profile: Identifies the clothing profile selected.*
Wind Direction & Terrain: Identifies the wind directions and terrain for each wind direction selected.
Key Board Controls: Keyboard short-cuts.
*These parameters will only be visible if you entered them at the time of submission. If you provided these directly to Orbital Stack after you submitted, they may not be available here.
13. Compass
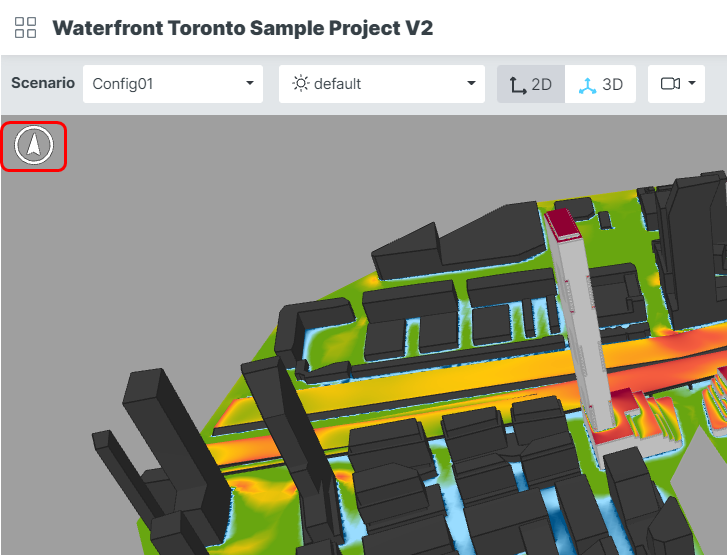
Refer to the small compass in the upper left-hand corner for North orientation. As you rotate your model the compass automatically adjusts and by clicking on the icon, it will automatically center your model with north facing up
14. Change the Theme