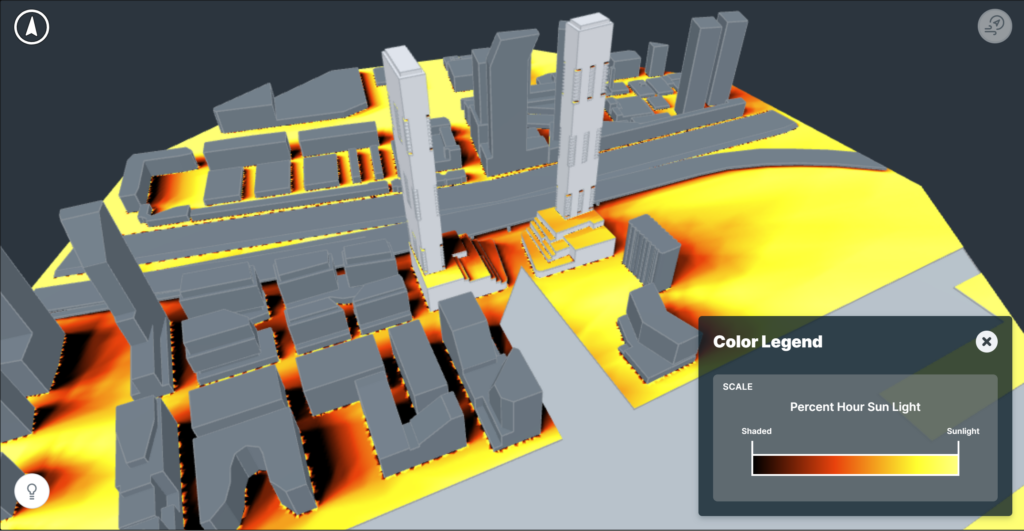
Orbital Stack takes a statistical approach to shadowing analysis. It indicates where shadows would generally fall for the given season (month range) and time of day (hour range), assuming the sky was clear every day of the year. Plots are generated for each season + time-range indicating the solar potential (from 0% to 100%) for the given period.
As a key driver of thermal comfort, being able to correlate and ultimately adjust the solar exposure of outdoor spaces is critical to achieving desirable outcomes.