
Orbital Stack’s Airflow analysis examines a location’s wind patterns by evaluating winds one direction at a time, revealing potential issues with usability, comfort, and safety when winds originate from the given direction.
Ground level winds and spatial streamlines are mapped onto a virtual model of a proposed design in the context of the local built environment. These visual guides show how winds reach critical areas of the site, offering important insights into local directionality and informing the best choices for mitigations. Wind flows and wind intensities are generated from the simulations of individual wind directions by injecting a wind profile that corresponds to the upstream terrain conditions, as specified in the terrain parameter of the simulation setup.
Airflow data is presented using one of two scales, a relative scale which simply indicates where winds accelerate and decelerate, and a climate-adjusted scale which indicates the wind intensity to expect in a location on a windy day
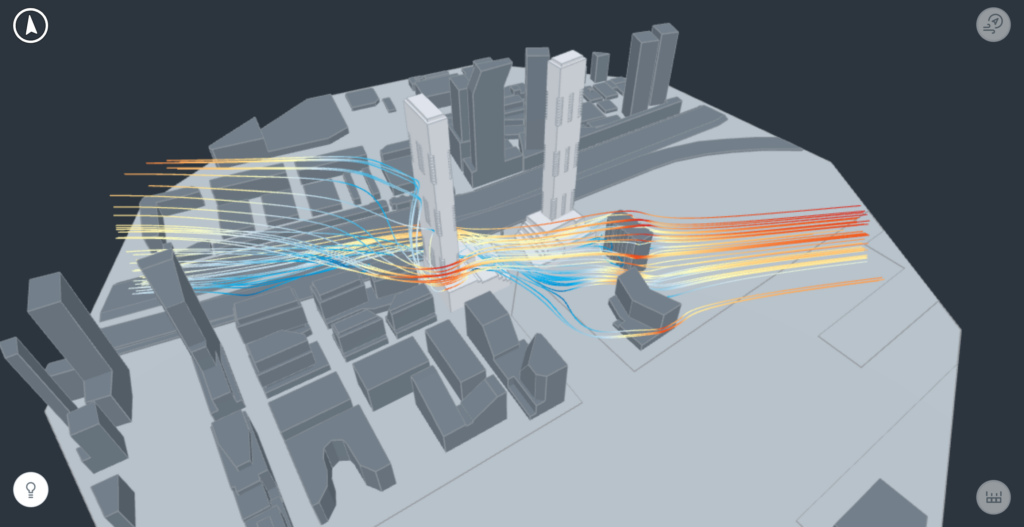
Three dimensional streamlines (volumetric plots) show how winds move through the spaces between and around the buildings and help to illustrate how higher level winds impact the studied pedestrian spaces. Streamlines represent the raw simulation results and are displayed using a relative wind speed scale.
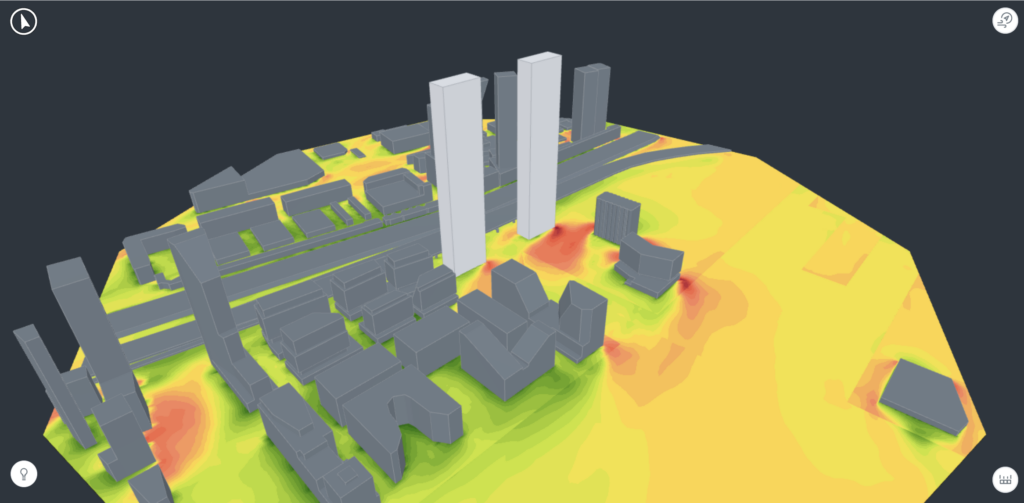
Pedestrian level contour plots (horizontal plots) show the wind intensity in the pedestrian realm (at ground or on terraces). These plots are scaled using the local climate data to reflect the directional differences in wind intensity. As such, they are displayed using the climate scaled directional wind speed legend.