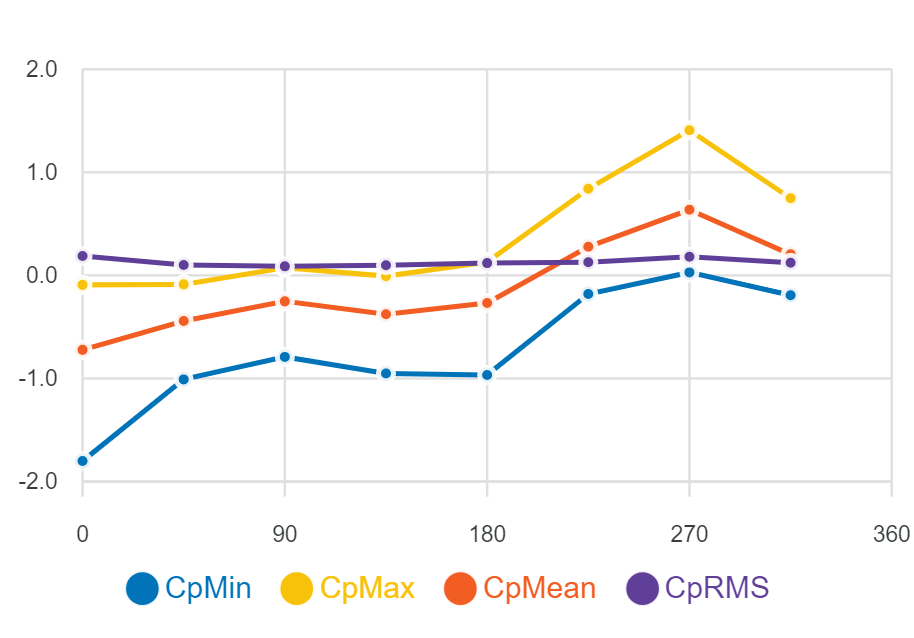
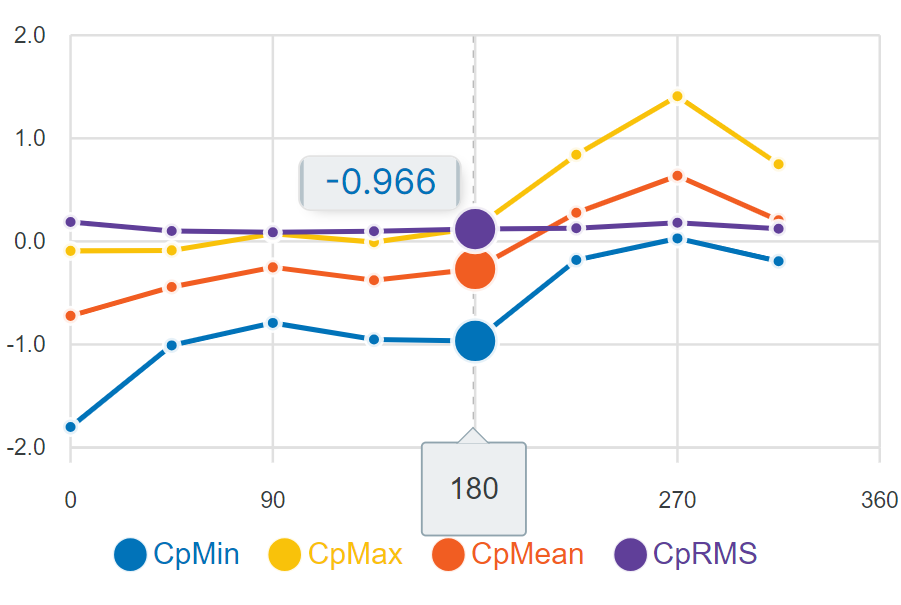
The Orbital Stack Viewer enables users to visualize Directional Pressure Coefficients within Cladding-AI simulations using a four-point pressure coefficient graph. This graph displays the Min, Max, Mean, and RMS pressure coefficients for each wind direction at selected points on a building’s façade.
What are Wind Pressure Coefficients?
Wind Pressure Coefficients (Cp) are a non-dimensional way of communicating the pressure on a building’s façade. One of the key benefits of using Cp values is that they remain consistent even if the approach speed (reference speed) or density at the site changes, making it a reliable parameter for comparing pressures under different conditions.
How to Access the 4-Point Graph
To view the Directional Pressure Coefficient Plots in your Cladding-AI simulation:
- Open the scenario of interest
- Select a data option: An option will appear in the menu for each reference height included in the simulation parameters plus the default height of 609m. Select the data you would like to use to plot the Cp graphs from the menu.
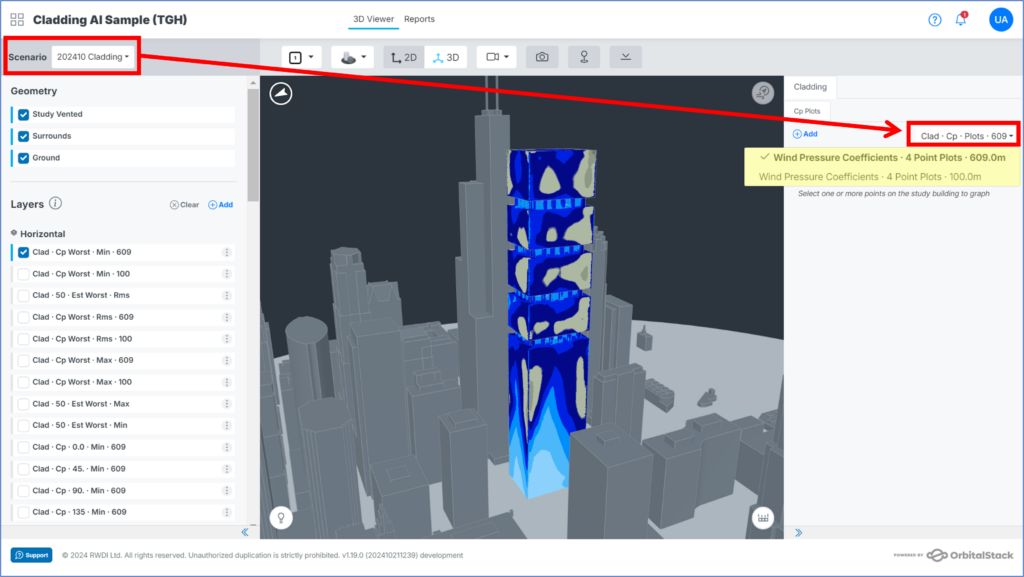
- Place Probes: Click add graph button to enable the probe placement. This allows you to place probes directly on your building’s geometry in the viewer. Simply click on the locations where you would like to capture wind pressure data, and a corresponding numbered graph will generate in the data panel. To stop placing probes, click the exit button.
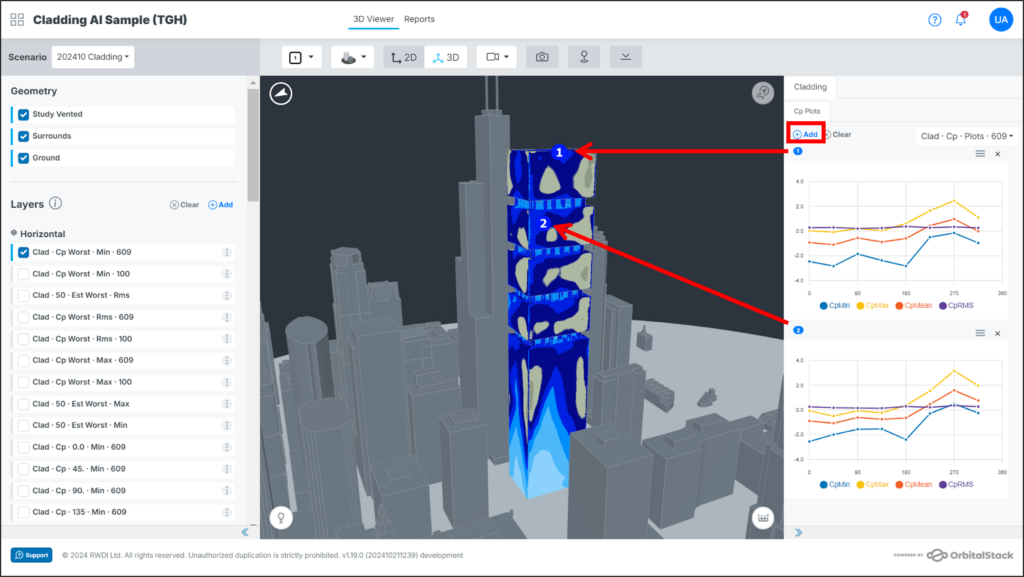
- View the Graph: The plots will automatically generate and appear in the data panel, displaying the relevant pressure coefficient data.
Adjusting or Removing Probes
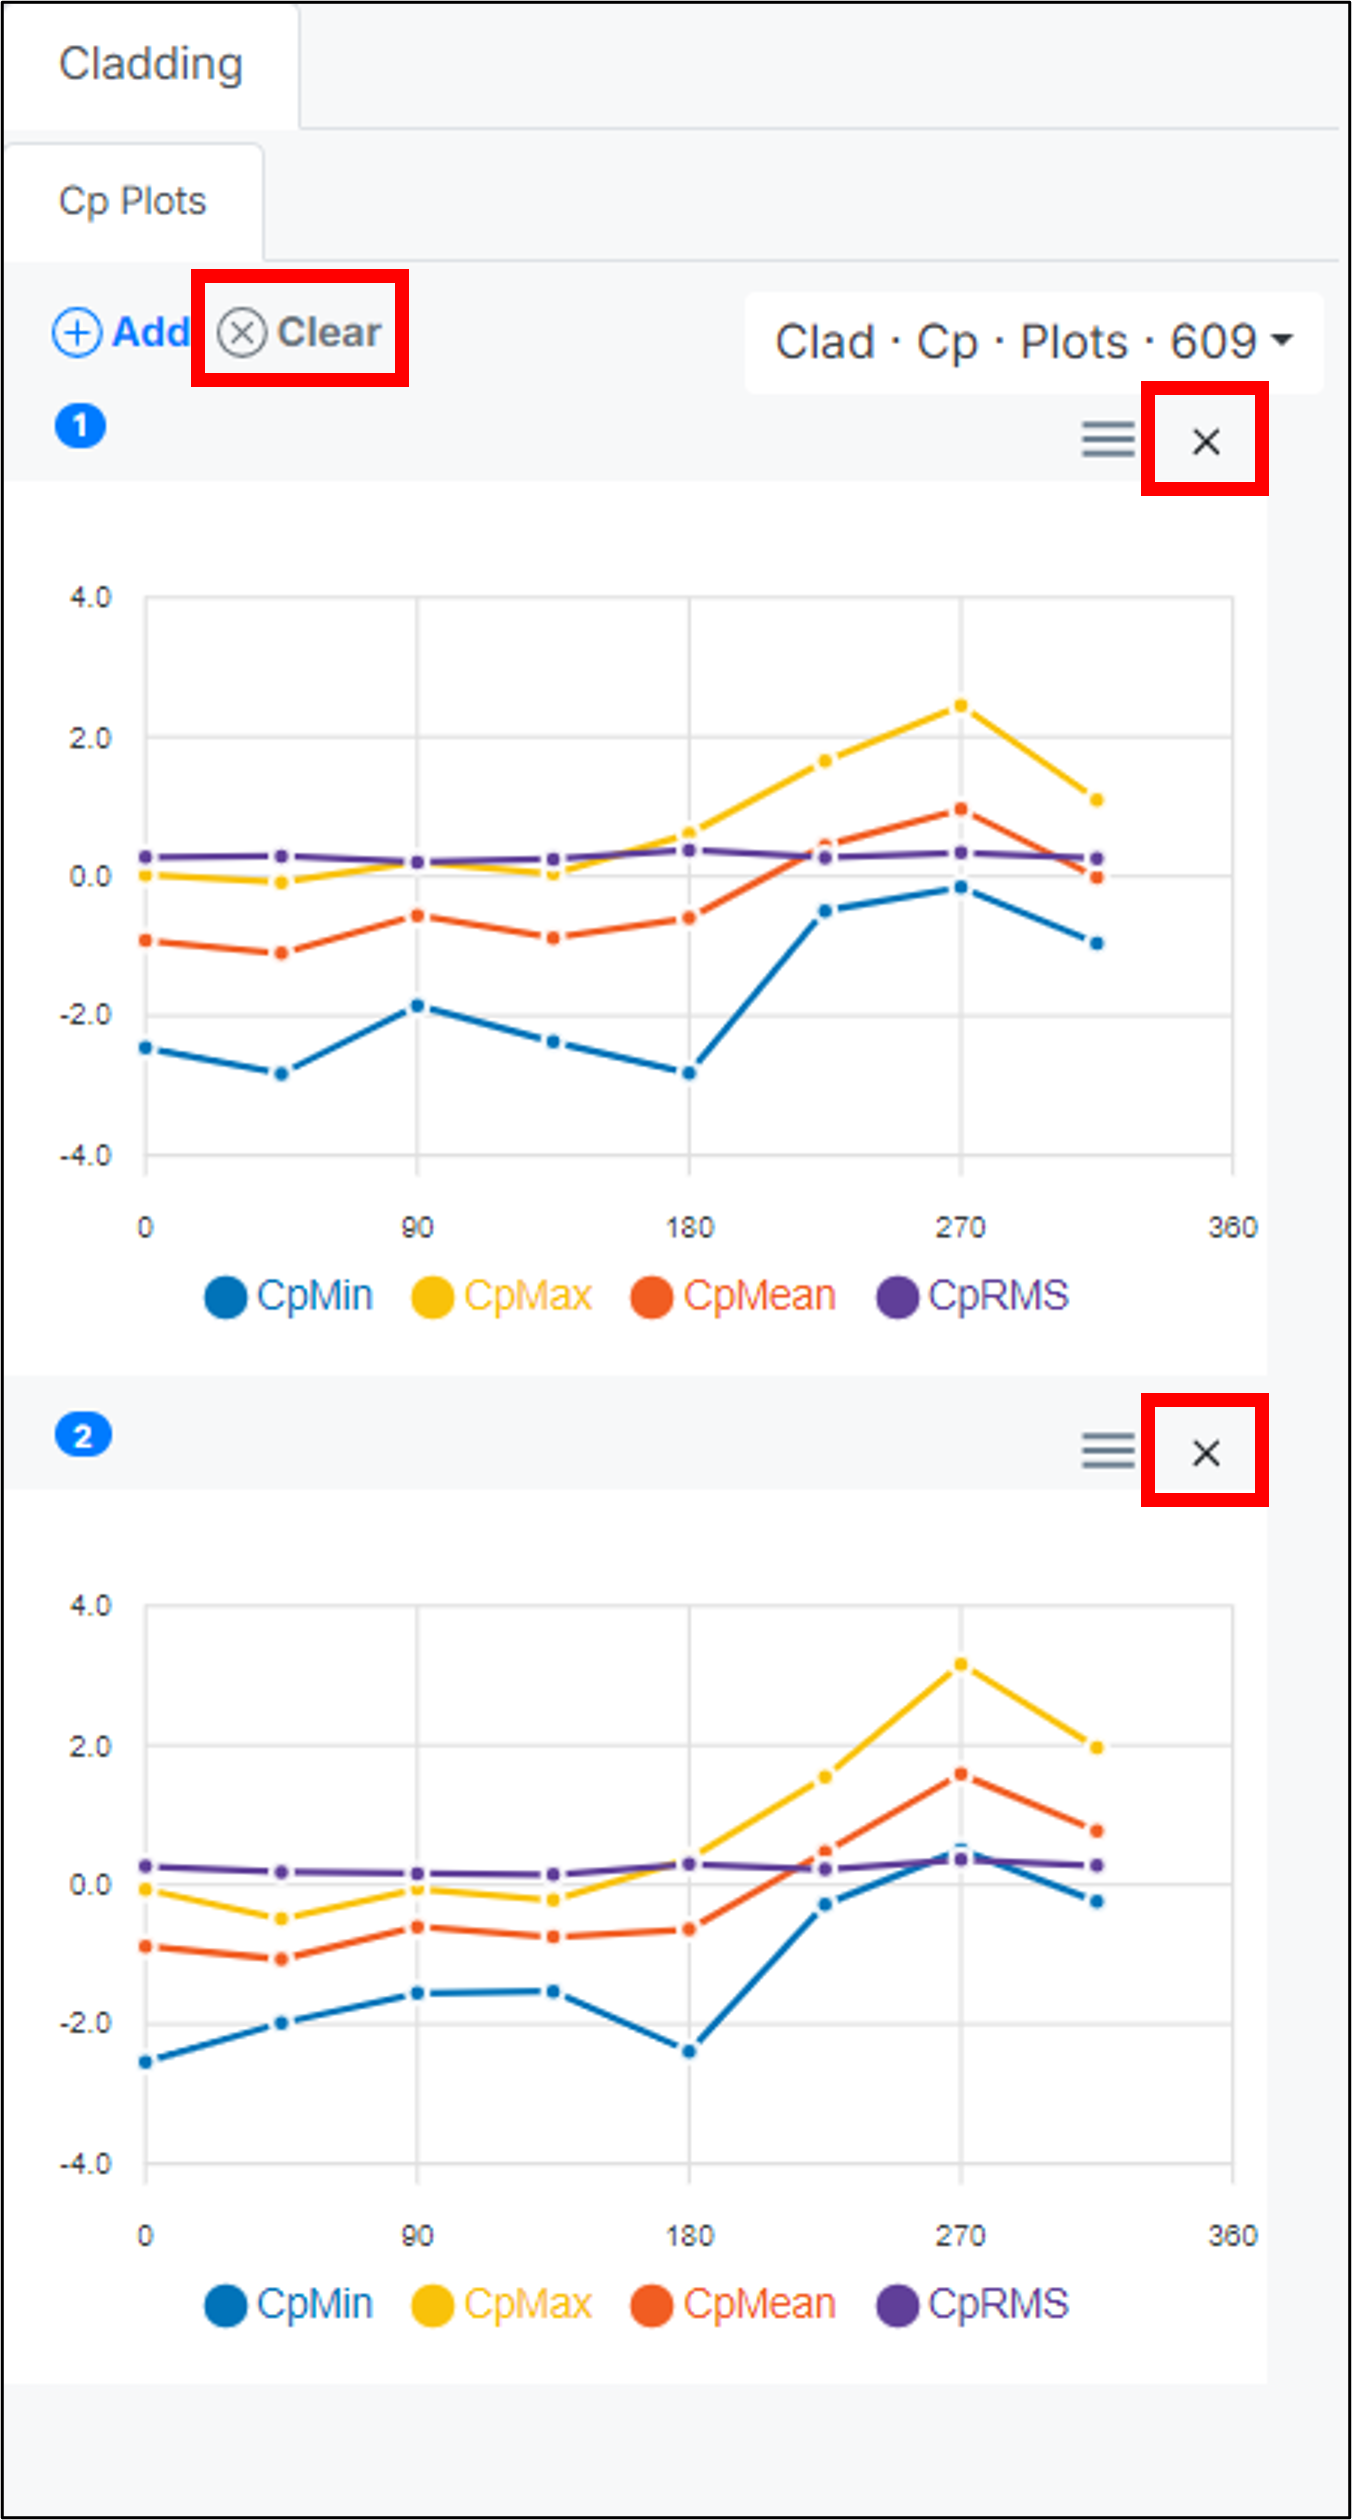
- Removing a single probe: If a probe is misplaced, click the “x” above the corresponding graph to remove it.
- Clearing all probes/graphs: To remove all probes and reset the graphs, use the “Clear” button.
Interacting with the Graph
- When you move your cursor over the graph, a tooltip will appear, displaying the exact data value for that point on the line.
Downloading the Graph
- Click on the menu icon located above each graph.
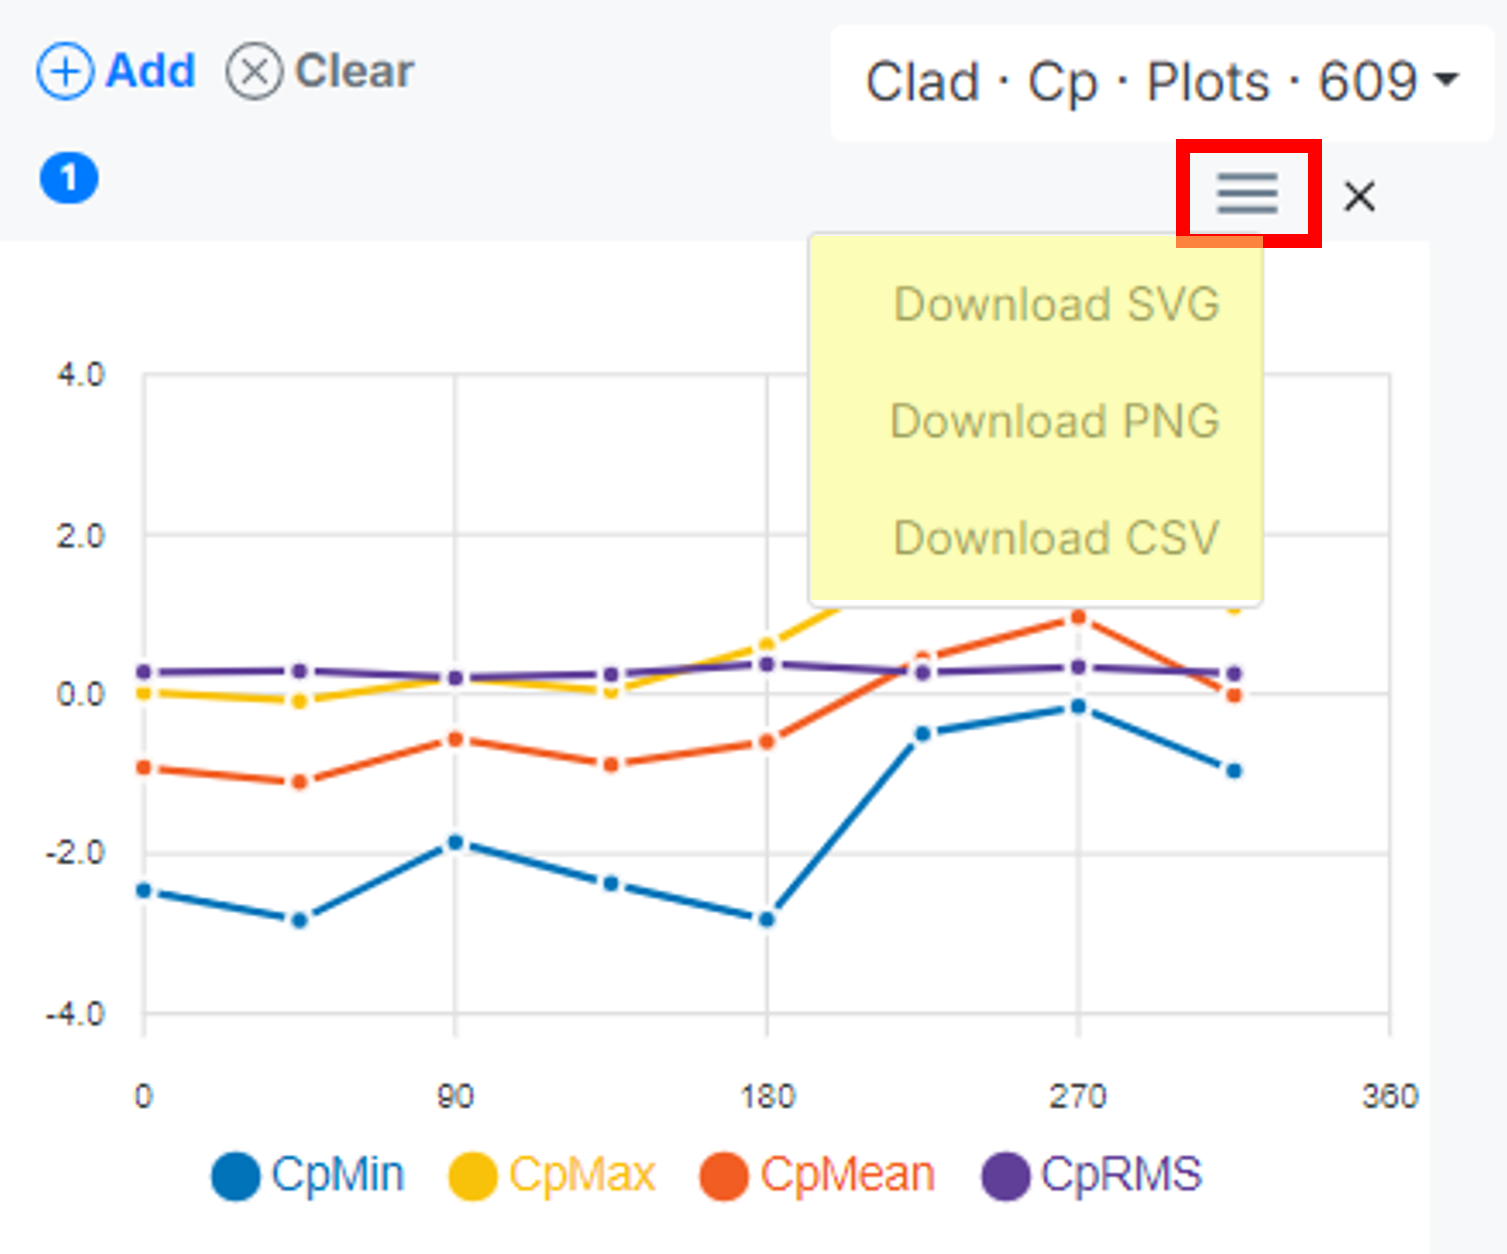
- Select the format you want to save the graph in:
- SVG (Scalable Vector Graphics): Best for high-quality, scalable images. SVG files can be resized without losing clarity, making them ideal for presentations, design work, or web use.
- PNG (Portable Network Graphics): A common pixel-based image format. PNG files are widely used for digital images and offer a good balance between quality and file size, though they don’t resize as well as SVGs.
- CSV (Comma-Separated Values): Ideal for exporting raw data in a structured format, perfect for analysis or manipulation in spreadsheet software like Excel or Google Sheets.
- The selected file will automatically download to your computer.