
Below is a description of how to interpret the Directional Wind Color Legend (Volumetric) that is visible in the viewer. Understanding these legends will help make the most out of analyzing your results.
What is it measuring?
Average wind speeds at a location for a given season and wind direction
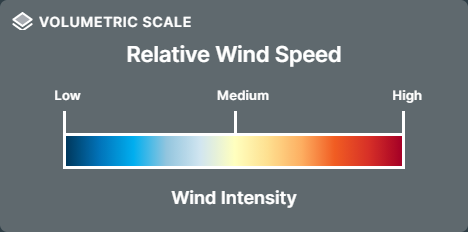
What does the scale mean?
The color scale indicates three types of zones; low, medium and high. These indicate a relative wind speed/intensity for a given area. The colors should not be taken as an absolute; they are meant to only indicate whether a specific location is expected to experience acceleration or deceleration of wind intensity.
The streamlines show how and where the wind flows around the buildings and space
What options can I specify?
None, this scale shows a relative flow and the plots are not seasonal nor scaled for climate data. Year-round conditions are used.